
Austin, area by area.
The portals generate these pages from a template and it shows. Ours carry real numbers with the source printed on the face of each one — and commentary from people who work the streets.
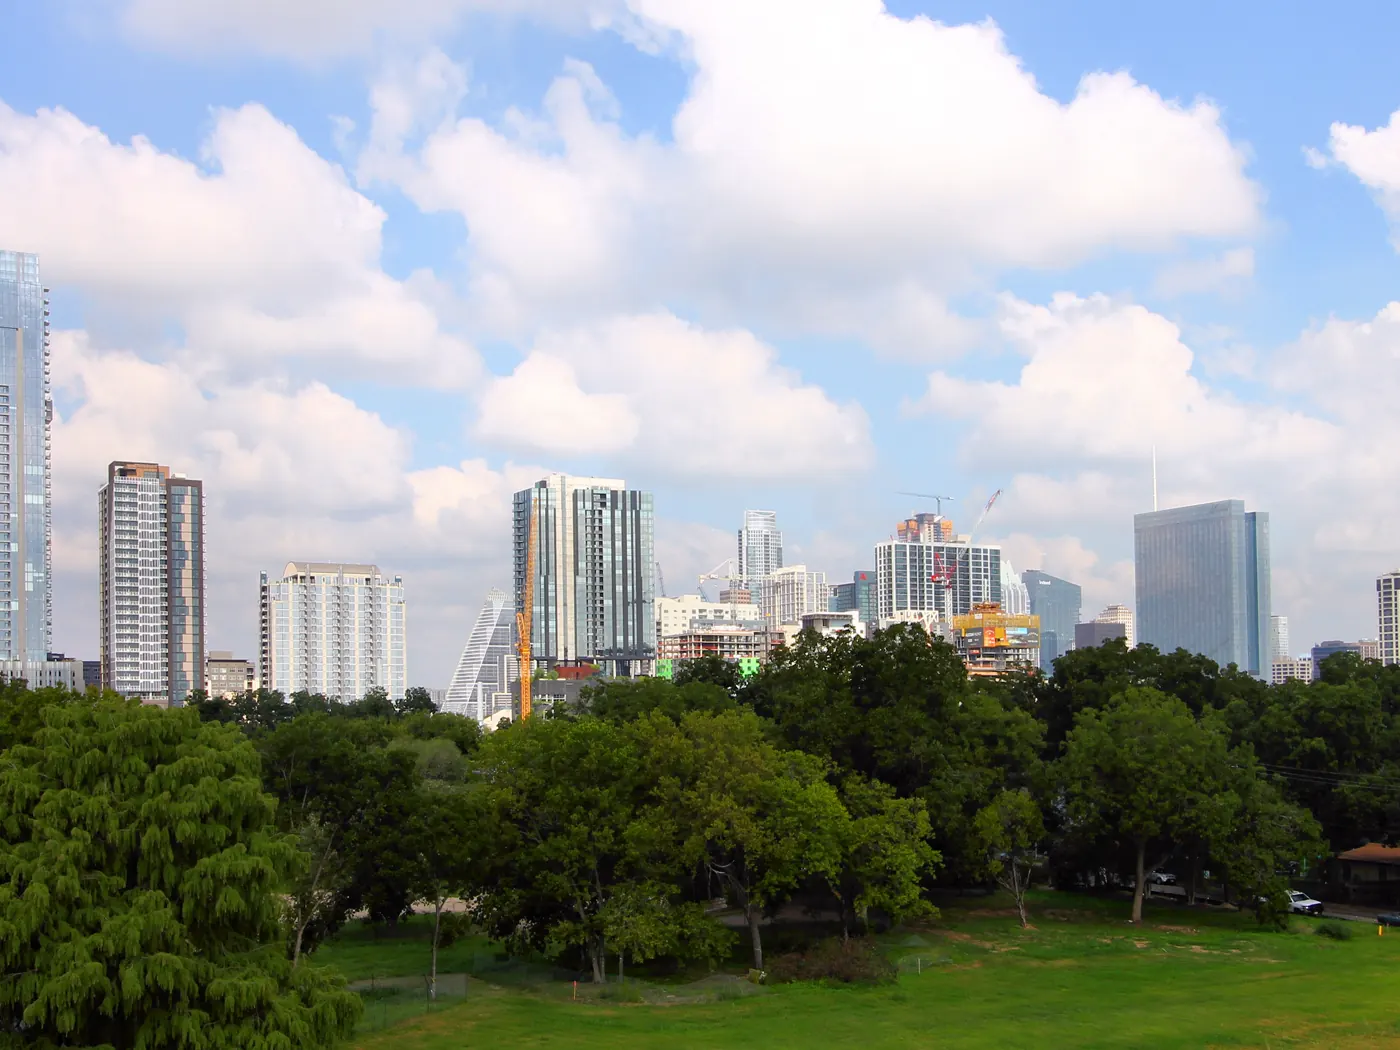
Downtown
High-rise condos and the shortest commute in the city. Almost entirely attached product, so HOA structure matters more here than lot size.
- Typical home value
- $660,440Zillow Research · 2026-07
- Homes for sale
- 239Zillow Research · 2026-07
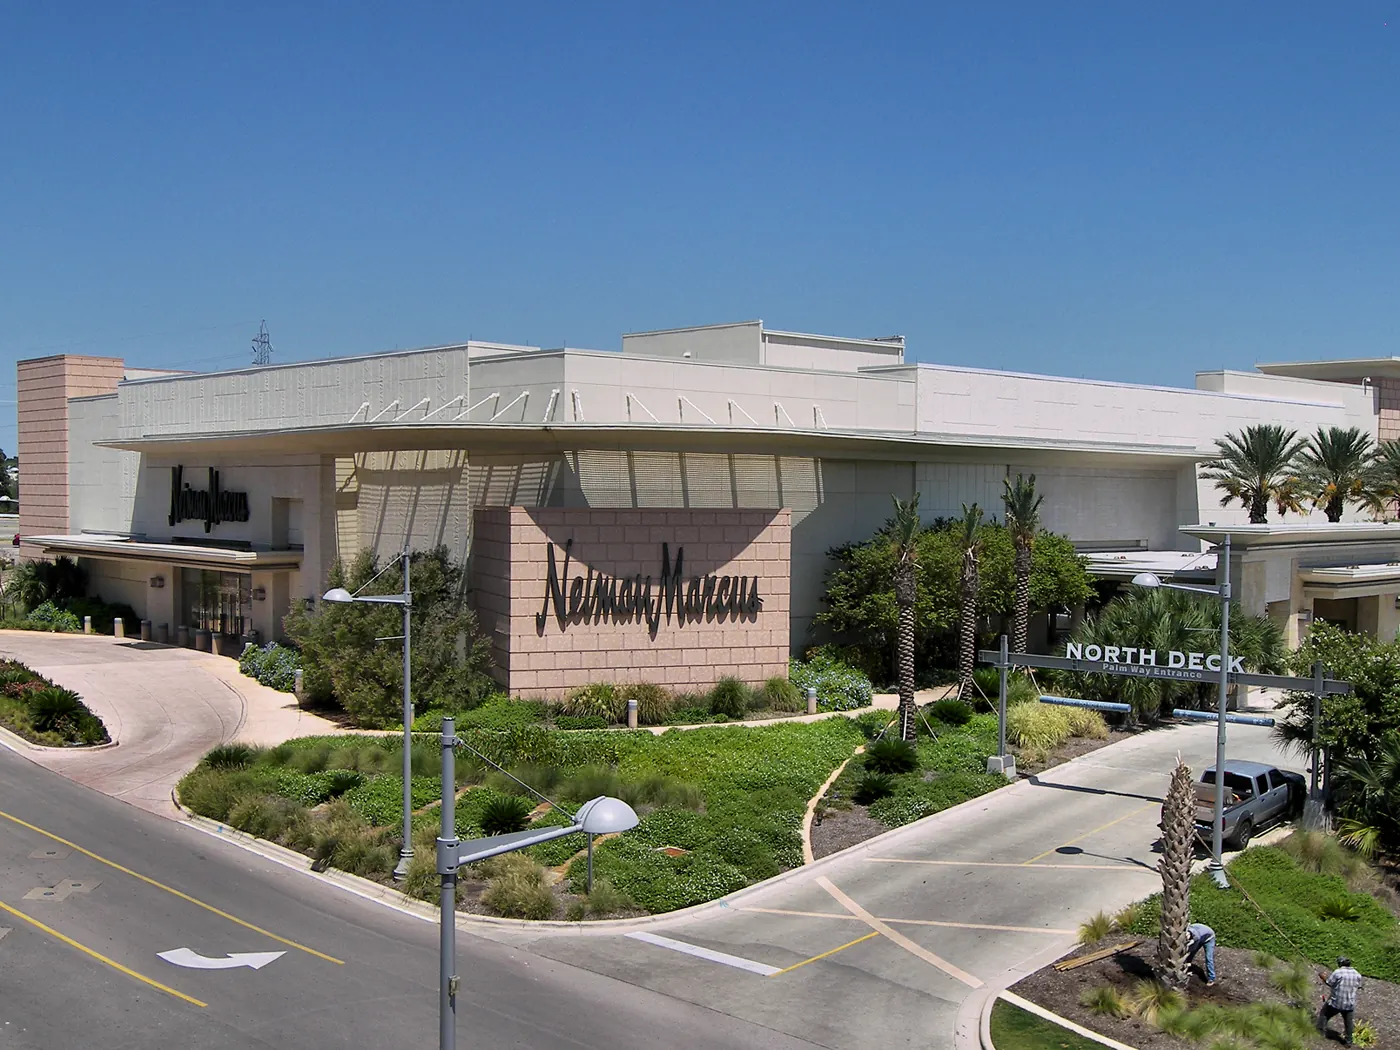
The Domain
North Austin's second downtown. Mixed-use density built around the tech corridor, with newer construction than almost anywhere else in the city.
- Typical home value
- $512,816Zillow Research · 2026-07
- Homes for sale
- 143Zillow Research · 2026-07
- Median days to pending
- 58 daysZillow Research · 2026-07

West Austin
Hills, larger lots and the top of the market. Eanes ISD boundaries drive a meaningful share of the price difference against comparable square footage elsewhere.
- Typical home value
- $1,409,384Zillow Research · 2026-07
- Homes for sale
- 117Zillow Research · 2026-07
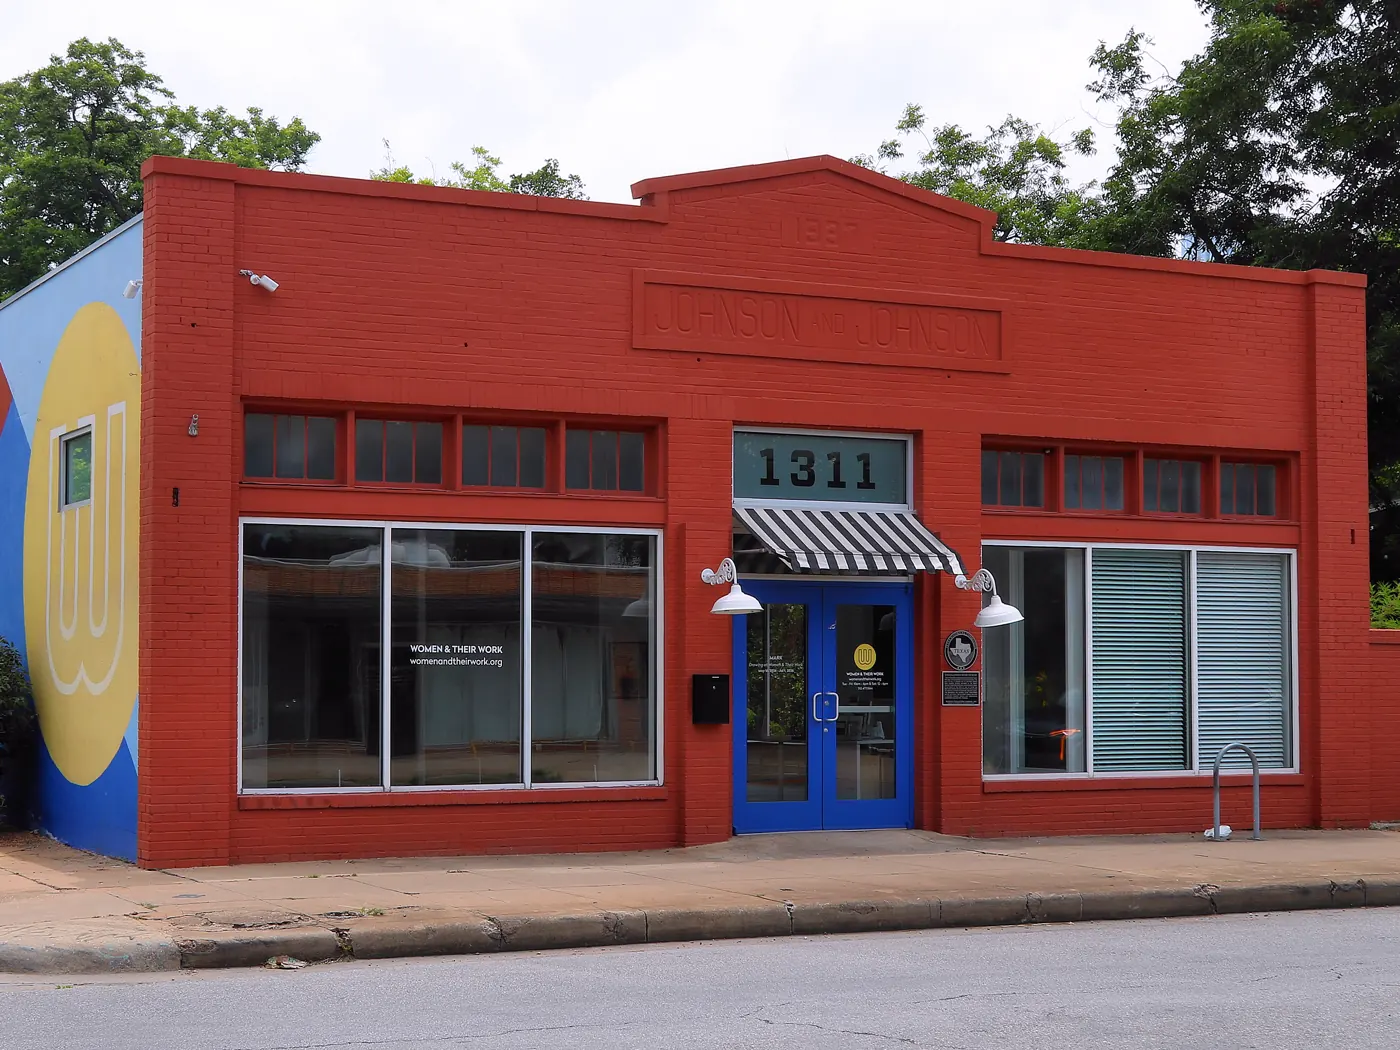
East Austin
The most varied housing stock in the city — 1930s bungalows next to new infill, often on the same block. Two homes at the same price can underwrite nothing alike.
- Typical home value
- $518,157Zillow Research · 2026-07
- Homes for sale
- 130Zillow Research · 2026-07
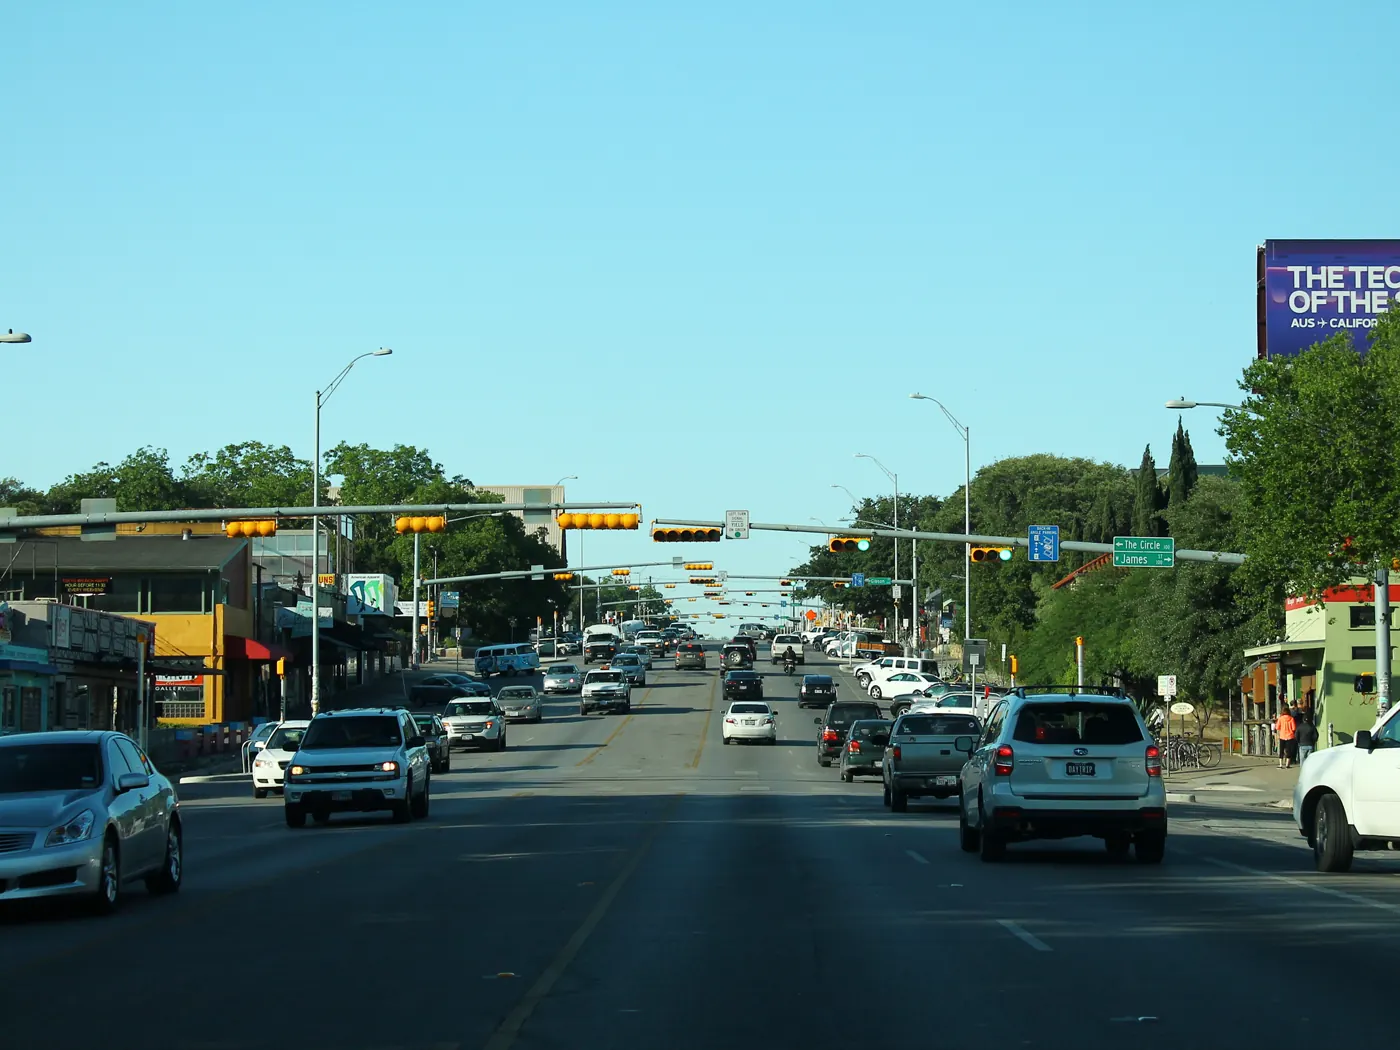
South Austin
Detached single-family at the widest range of price points in the city, stretching from Bouldin down through the 78745 corridor.
- Typical home value
- $568,930Zillow Research · 2026-07
- Homes for sale
- 292Zillow Research · 2026-07
- Median days to pending
- 78 daysZillow Research · 2026-07
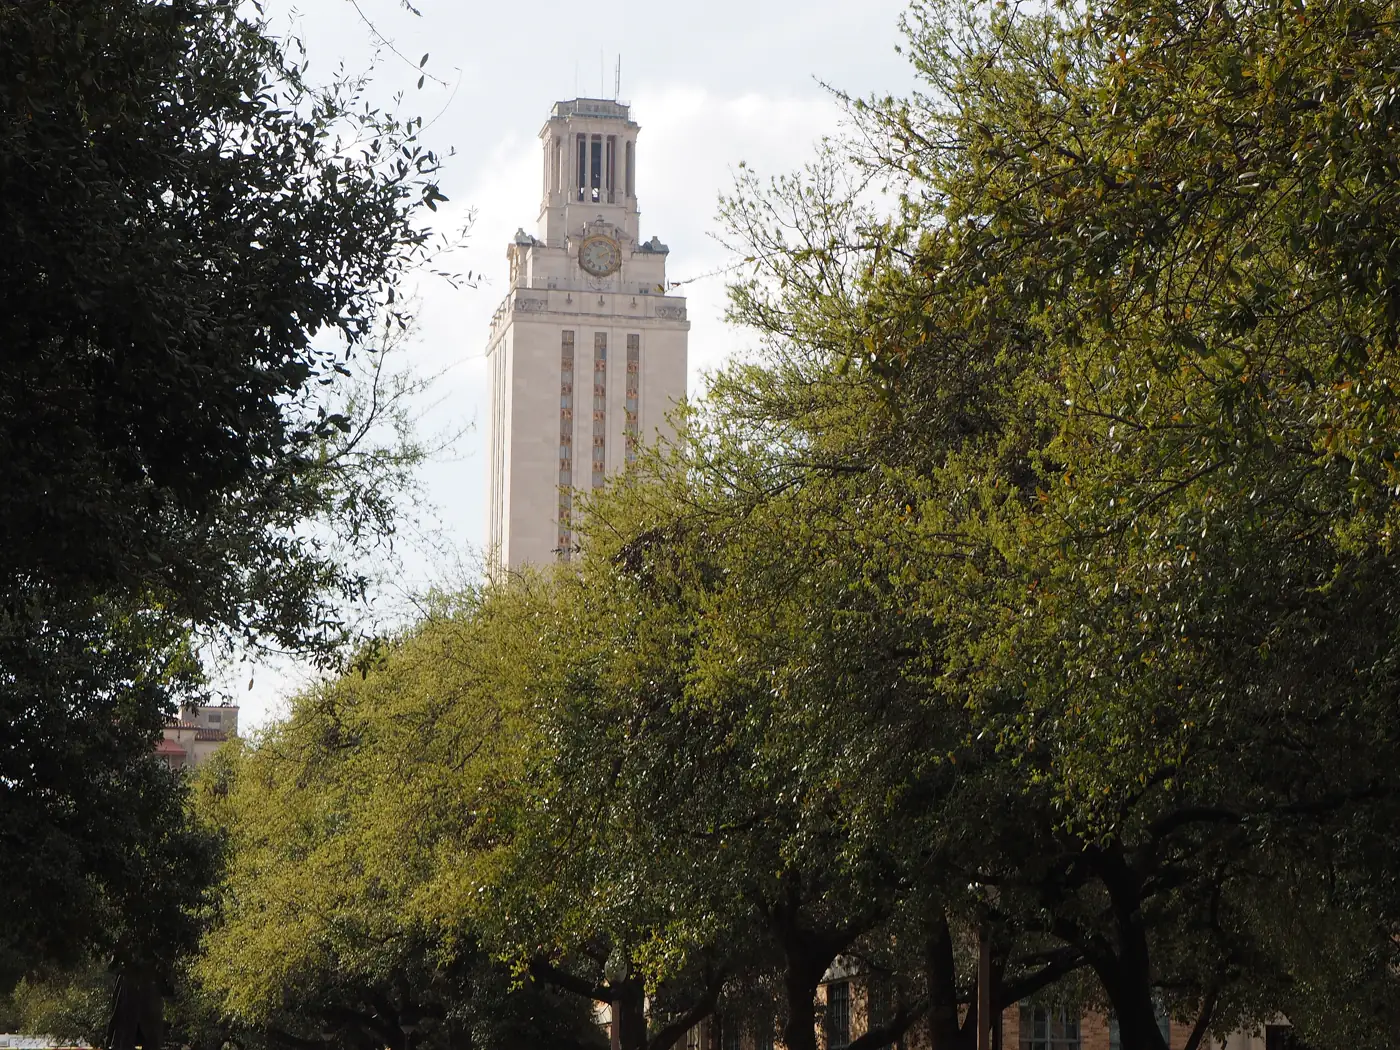
Central Austin
Hyde Park, North Loop and the blocks around the university. Pre-war bungalows on small lots, a high share of duplex and converted-multifamily product, and the shortest bicycle commute to campus of any area we cover.
- Typical home value
- $545,809Zillow Research · 2026-07
- Homes for sale
- 104Zillow Research · 2026-07
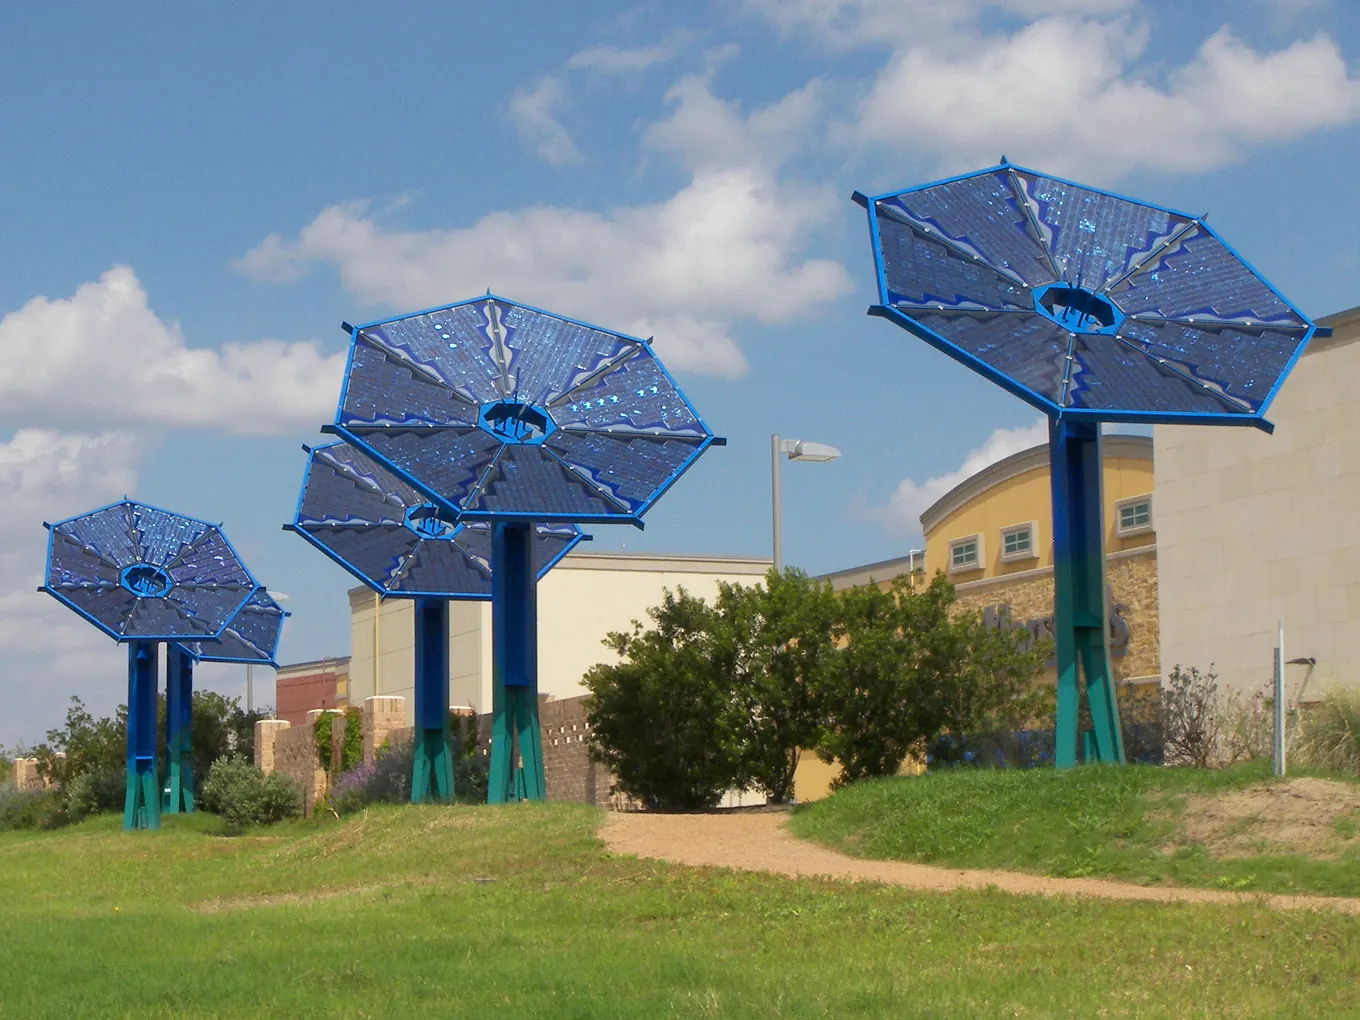
Mueller
A planned redevelopment on the old airport site, plus the established blocks around it. Almost entirely post-2007 construction to a single design code, which makes it the most predictable stock in the city to underwrite.
- Typical home value
- $397,704Zillow Research · 2026-07
- Homes for sale
- 159Zillow Research · 2026-07
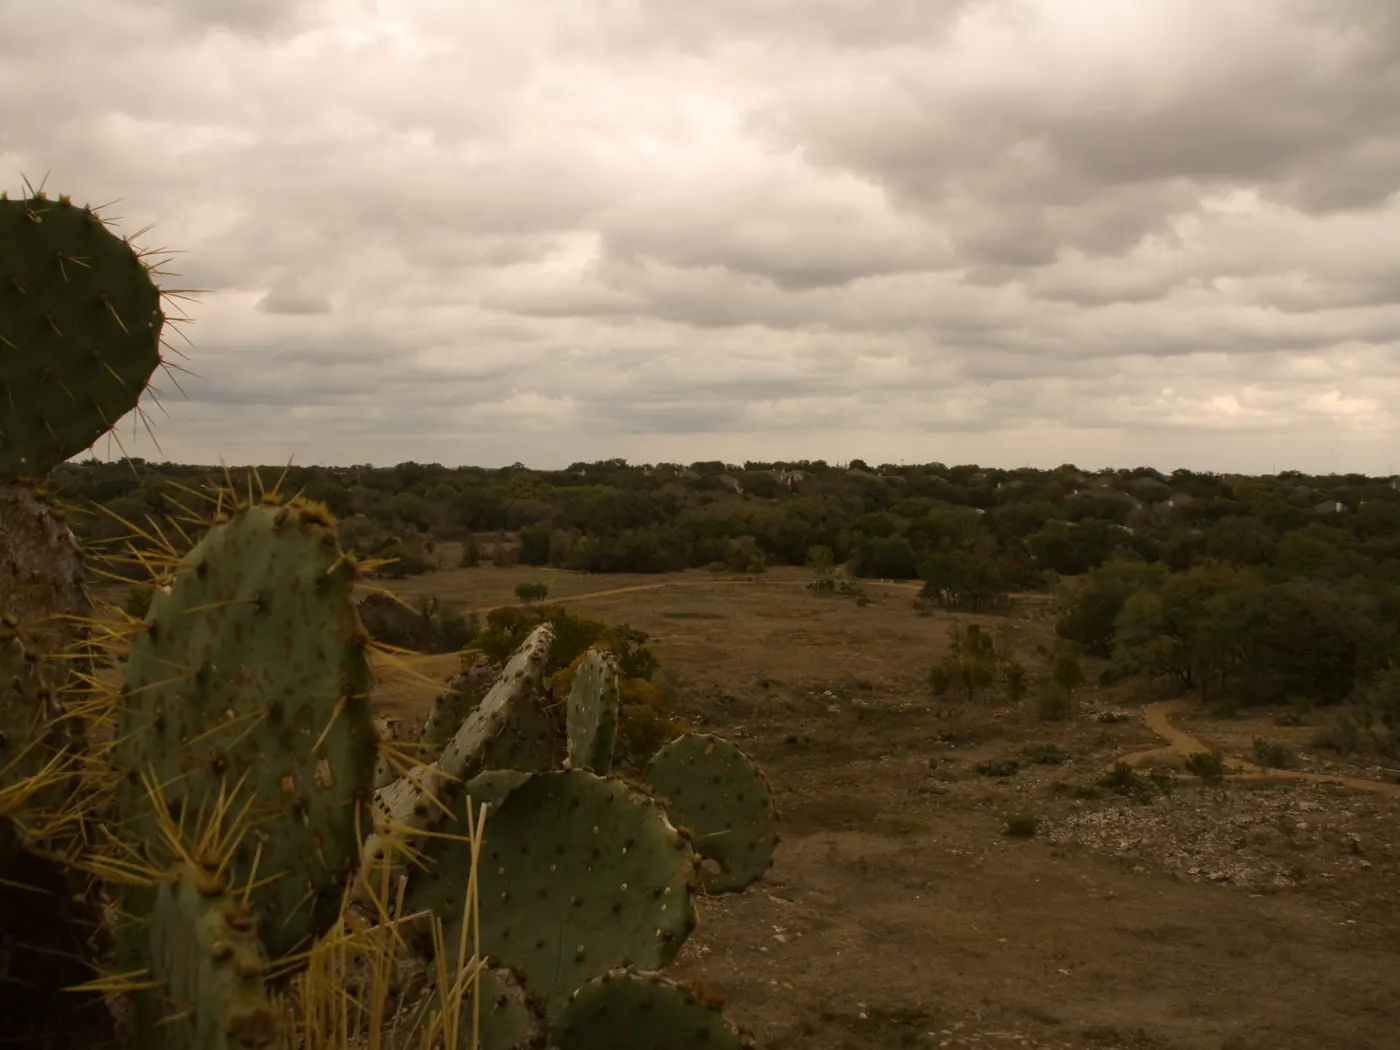
Southwest Austin
Circle C, Shady Hollow and the hill-country edge past MoPac. Larger lots, newer detached construction, and the longest drive downtown of the Austin-proper areas we cover.
- Typical home value
- $681,989Zillow Research · 2026-07
- Homes for sale
- 144Zillow Research · 2026-07
- Median days to pending
- 56 daysZillow Research · 2026-07
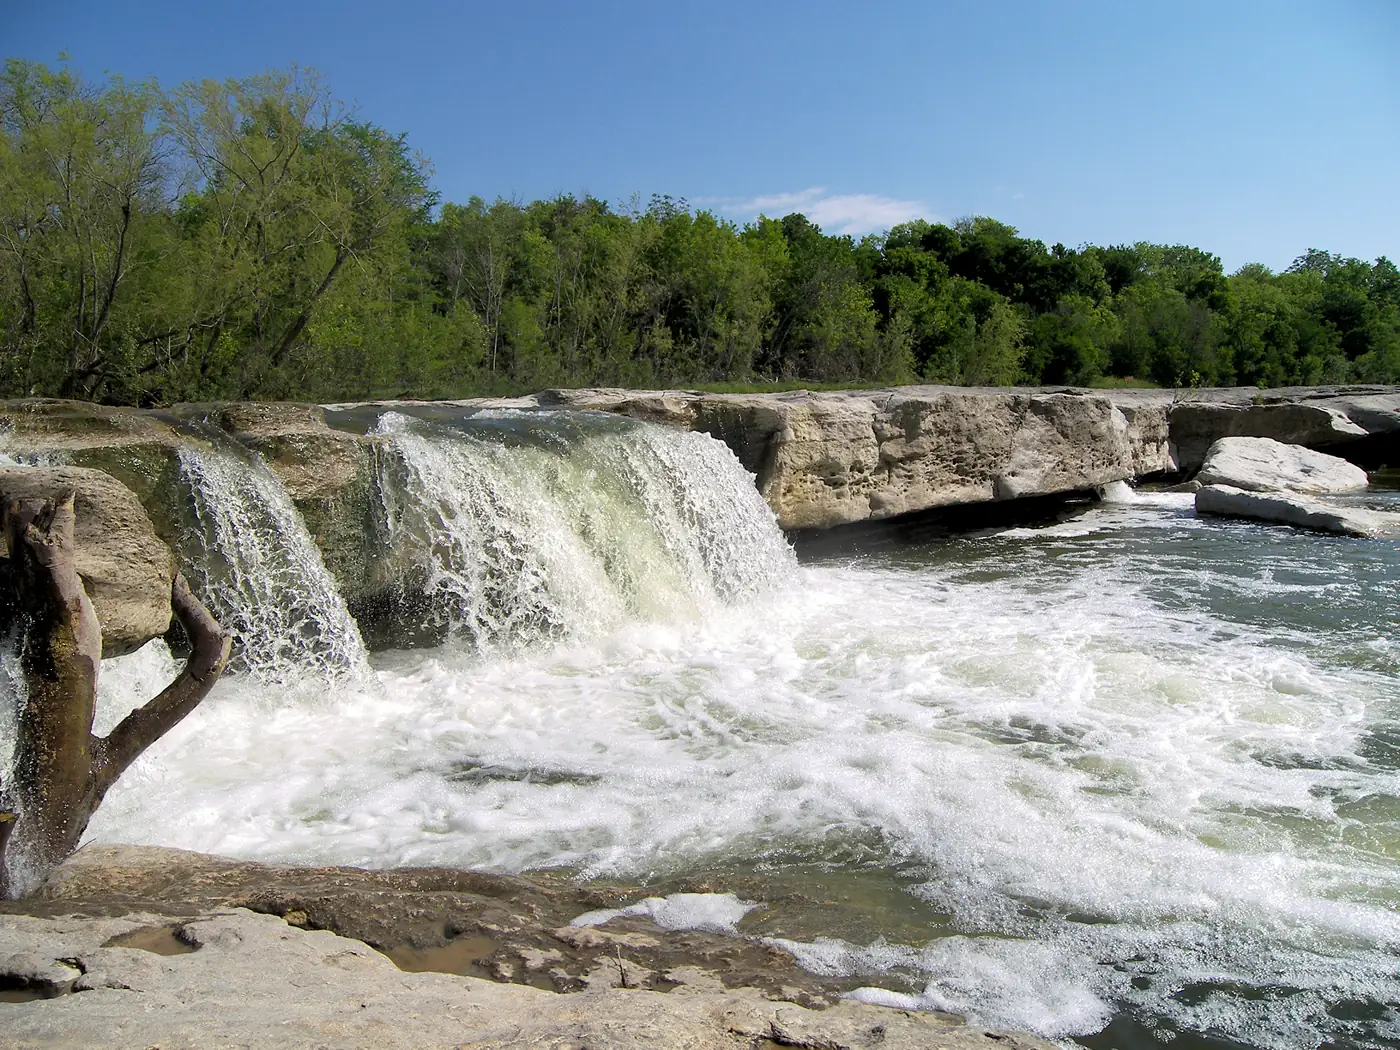
Southeast Austin
Riverside, Montopolis and the blocks toward the airport. The lowest entry prices of any area we cover, a large rental share, and the shortest drive to the airport in the city.
- Typical home value
- $325,282Zillow Research · 2026-07
- Homes for sale
- 141Zillow Research · 2026-07
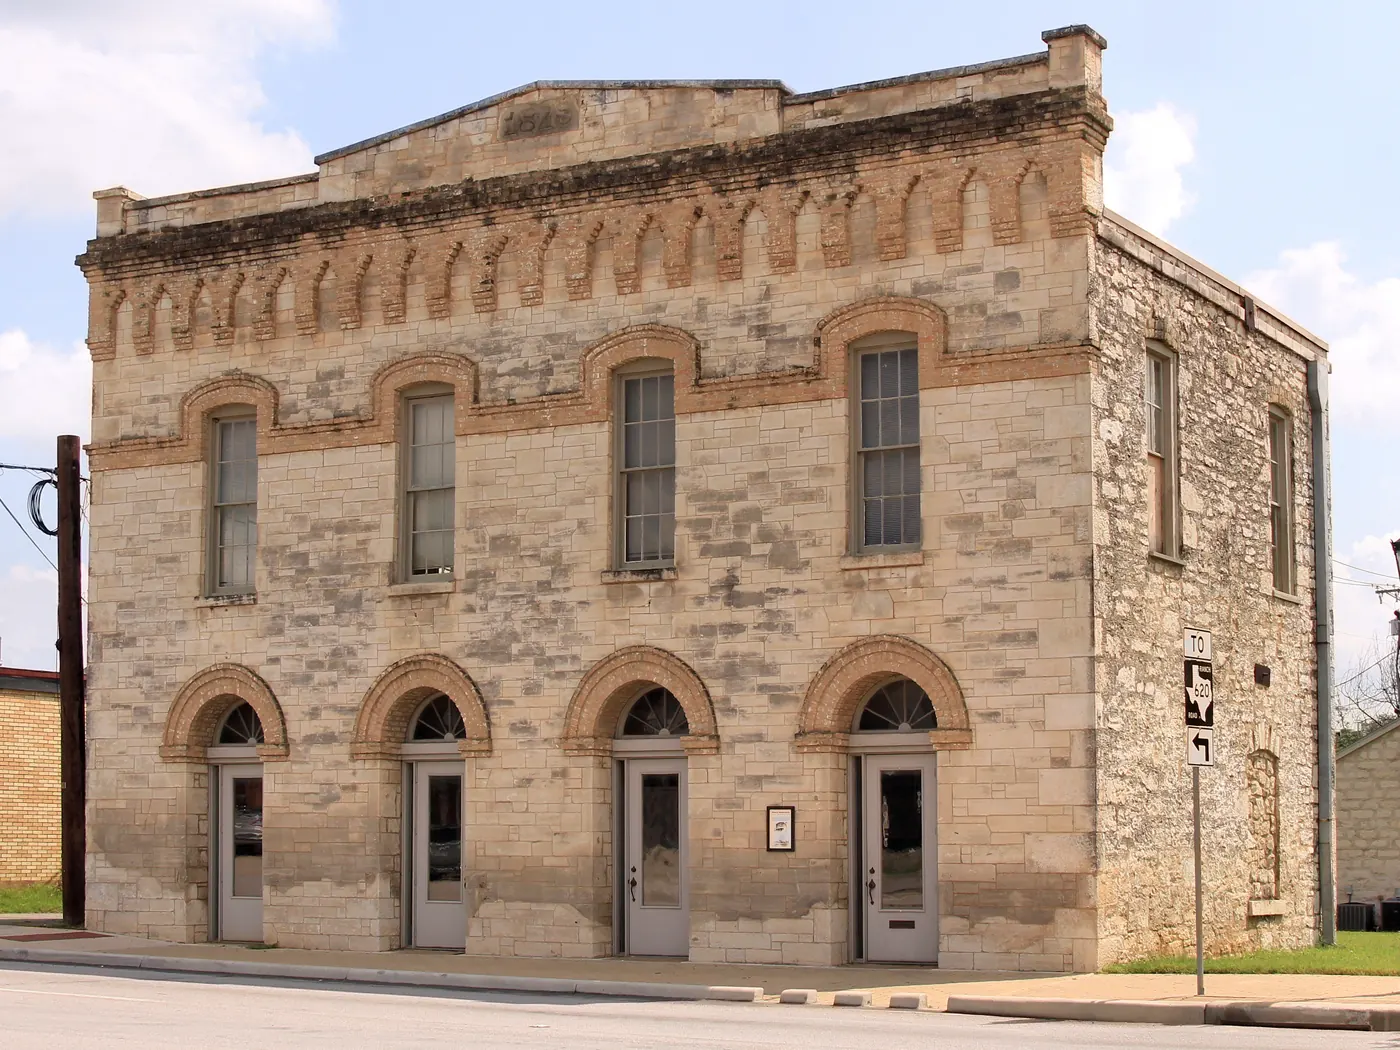
Round Rock
North of the city line in Williamson County, which means a different tax structure and a different set of school districts. Predominantly detached subdivision construction from the 1990s onward.
- Typical home value
- $407,455Zillow Research · 2026-07
- Homes for sale
- 288Zillow Research · 2026-07
- Median days to pending
- 62 daysZillow Research · 2026-07
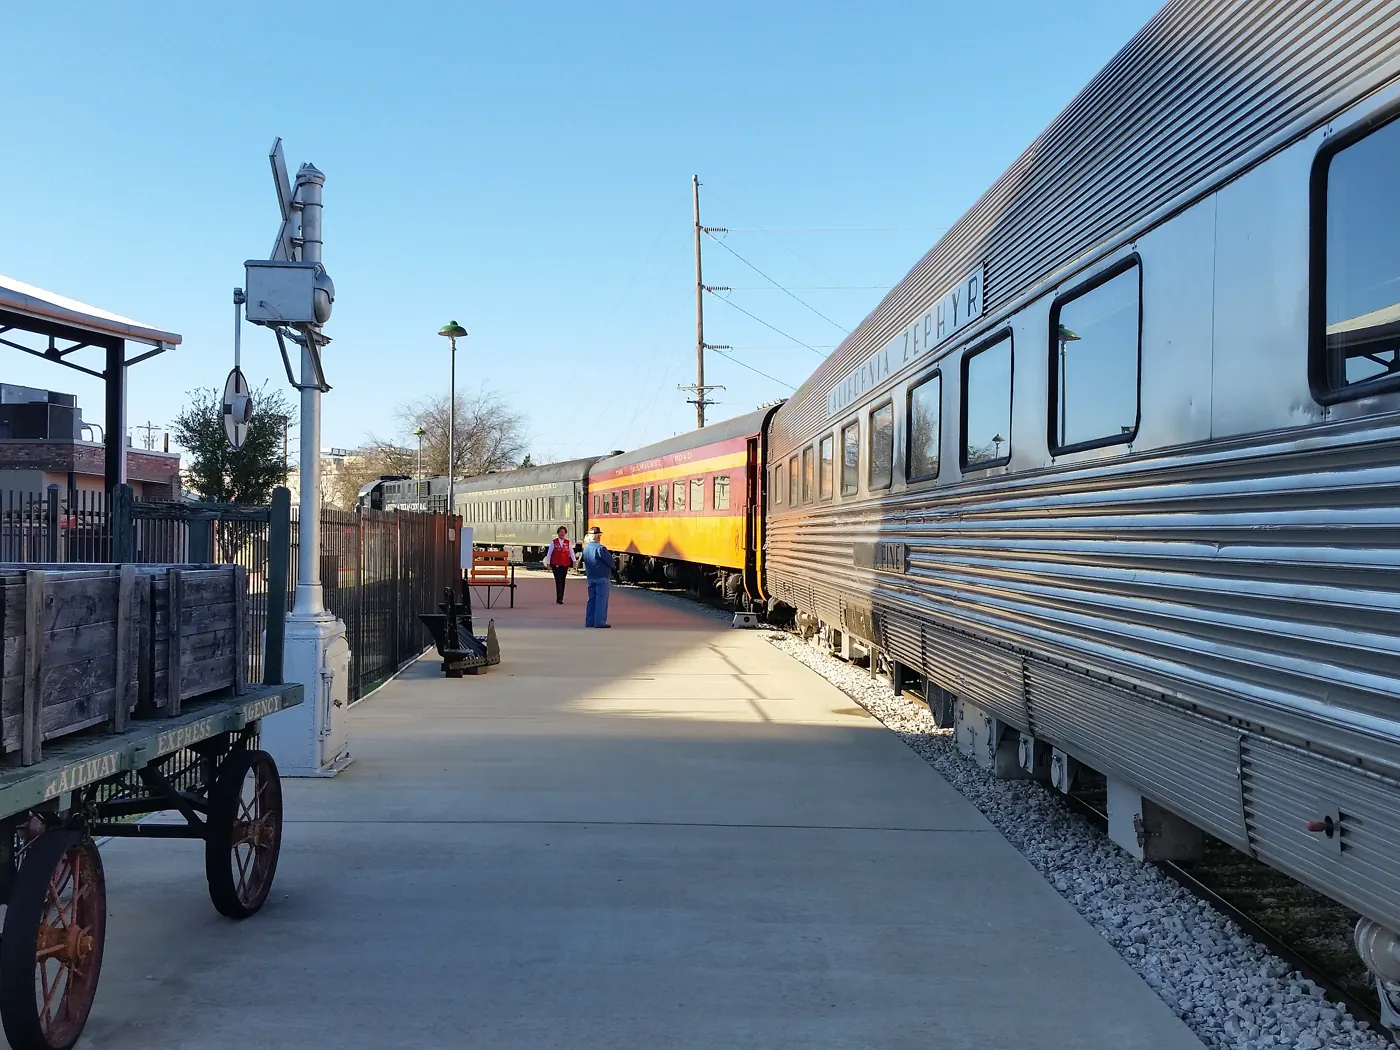
Cedar Park
Cedar Park and Leander, at the northwest edge of the metro. The newest housing stock outside Mueller, and the only area we cover served by the commuter rail line.
- Typical home value
- $448,780Zillow Research · 2026-07
- Homes for sale
- 592Zillow Research · 2026-07
- Median days to pending
- 69 daysZillow Research · 2026-07
Where sellers are asking the most over.
Zillow models what homes in each ZIP are worth. Realtor.com reports what the homes currently listed there are asking. The difference is negotiating context, and it is not the same in any two areas.
- West Austin+21.5%$1,409,384 modeled · $1,712,300 asking
- East Austin+13.2%$518,157 modeled · $586,667 asking
- Mueller+10.6%$397,704 modeled · $440,009 asking
- Cedar Park+10.2%$448,780 modeled · $494,749 asking
- South Austin+5.7%$568,930 modeled · $601,317 asking
- Southeast Austin+4.6%$325,282 modeled · $340,250 asking
- Round Rock+3%$407,455 modeled · $419,833 asking
- The Domain+2.8%$512,816 modeled · $527,250 asking
- Downtown+0.7%$660,440 modeled · $664,975 asking
- Southwest Austin+0.1%$681,989 modeled · $682,583 asking
- Central Austin+0%$545,809 modeled · $546,000 asking
Zillow Research and Realtor.com, both 2026-08-31. These measure different populations — every home in the ZIP against only the homes listed for sale — so part of each gap is seller pricing and part is that active inventory is not a representative sample. Neither is an appraisal.
Area information is provided for every neighborhood we cover, to every visitor, without regard to any protected characteristic. Figures carry their source and date. Sprout Realty does not steer clients toward or away from any area.